penguins_by_species <-
penguins |>
count(species)
ggplot(
penguins_by_species,
aes(
x = species,
y = n,
fill = species,
label = n
)
) +
geom_bar(stat = "identity") +
scale_fill_viridis_d() +
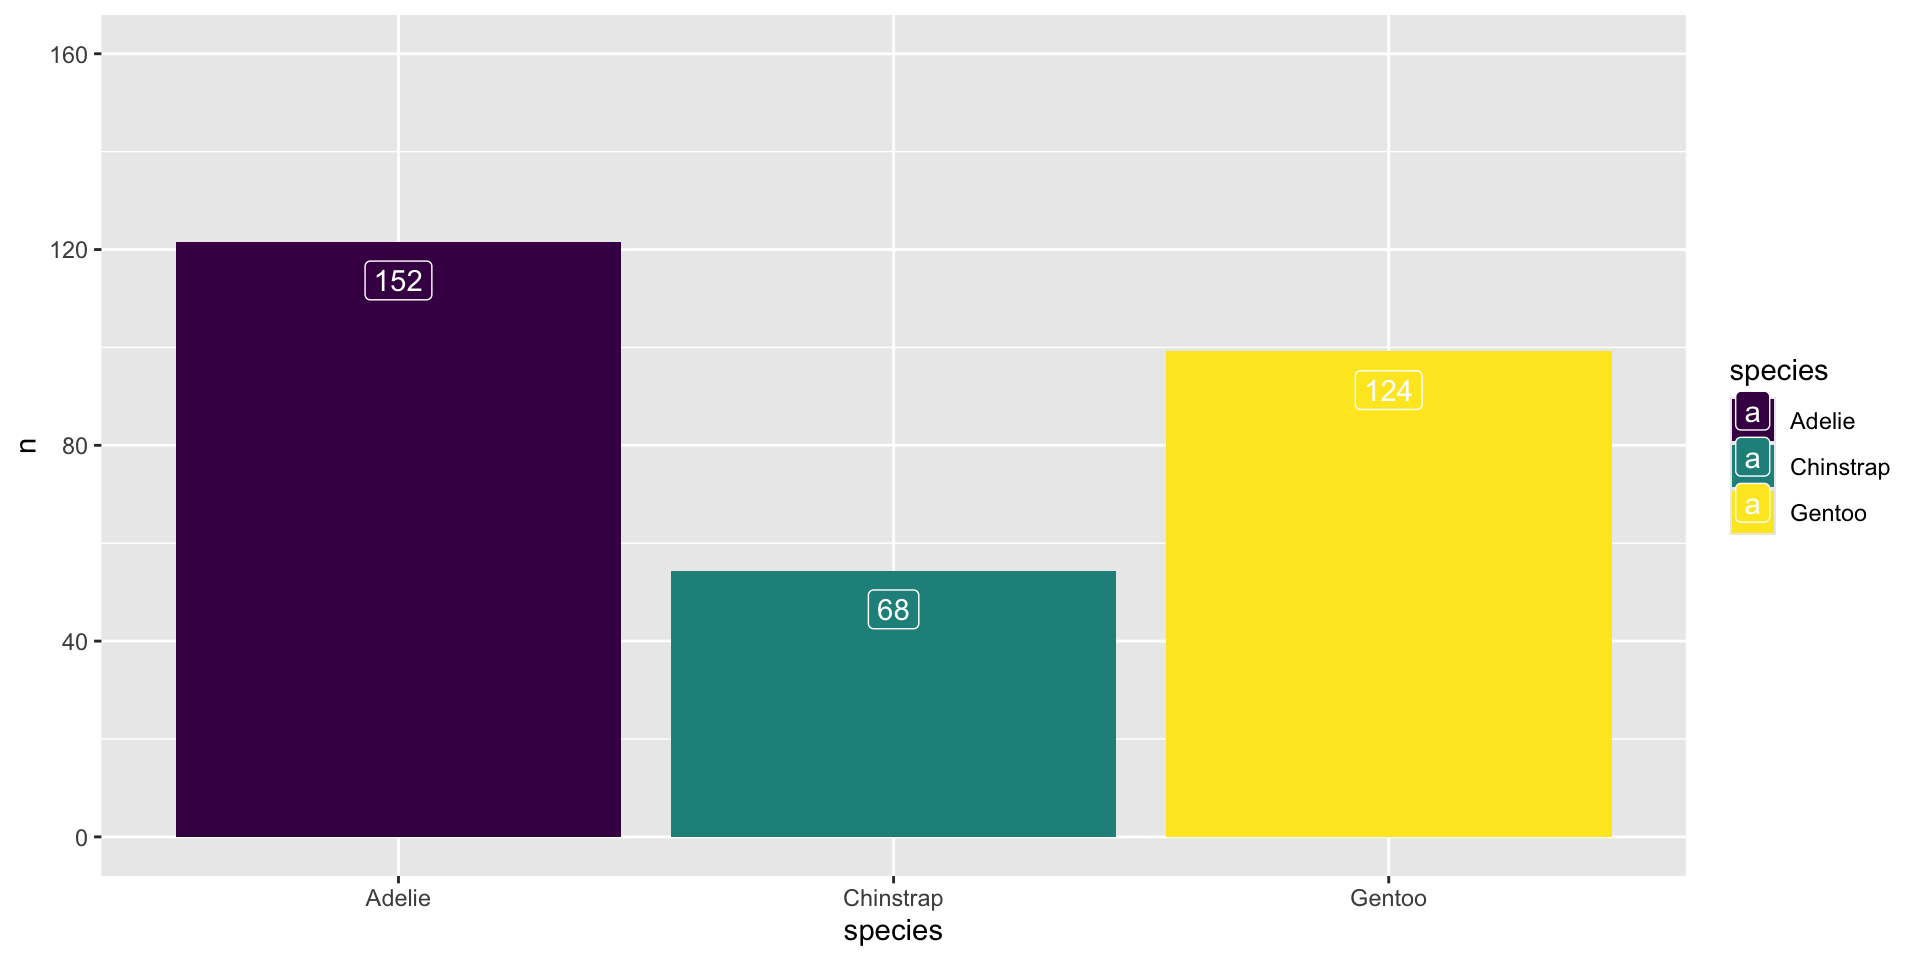
scale_y_continuous(
limits = c(0, 200),
labels = c(0, 40, 80, 120, 160)
) +
geom_label(vjust = 1.5, color = "white")R in 3 Months Week 3 (Data Visualization)
What is the most confusing thing about ggplot?
Please put your answer in the chat!
Agenda
Housekeeping
Example projects
Data viz tips
Data viz exercise
Next week
Housekeeping
Problems with Videos?
Housekeeping
- Co-working session next week will be Monday instead of Tuesday (same time)
Example Projects
Data Viz Tips
Color vs fill
Why is it that the color= option is treated differently by geom_point and geom_col? The logic seems inconsistent here since “color=” is used as if it is “fill =” by geom_point. What if I want the scatter plot to have black dots with outline color different by island?
Applying values specific color/fill properties
When using scale_color_manual, do you need to specify the order in which colors are applied to a certain category? I assume it matters. How will I know which colors are being applied to specific data?
Labels vs breaks
Why is this code showing the text 152 above the y axis text 120?
Is there a “correct” order to put geoms, scales, themes, etc?
Dropping points in scatterplots
Width of bars in bar charts
Reordering bar charts
Wrapping long text in charts
Data Viz Exercise
Data Viz Exercise
Next Week
You’ll be learning about Quarto!
Course assignment: learn the basics of Quarto
Project assignment: take what you’ve done so far and turn it into a Quarto document